Comparing the Cost of Employer-Sponsored Health Plans in America
Call it the Era of Insurance Uncertainty. Between Washington’s inconclusive battles about the health care law and continually rising premiums, many Americans feel more concern than clarity about affording health care in the future.
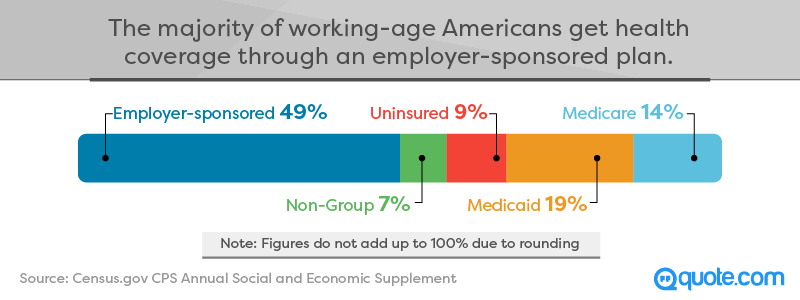
But in the midst of all the policy and politics, an essential piece of our health insurance marketplace is often overlooked: employer-provided health insurance plans. These are the plans that jobs offer their employees, and they’re the single largest source of insurance for Americans, far ahead of federal programs like Medicare and Medicaid. In fact, if you’re currently of working age, you may be covered by one yourself.
If so many of us are covered by these plans, why don’t we talk about them more often? For one thing, workers don’t get much of a say when it comes to picking the benefits their employers will offer. Another reason may be that the costs of employer plans seem relatively stable: While they typically increase slightly every year, we don’t necessarily realize when those hikes hit our wallets. Compare that to projected spikes in “Obamacare” premiums, and folks with employer plans are sitting pretty, right?
Not quite, unfortunately. Around the country, employees are taking on a greater percentage of the cost of their plans every year, as employers shift more of the shared expense onto their workers. If you haven’t already noticed the increase, that’s probably because it’s coming directly from your paycheck.
Plus, the average employee deductible has increased by roughly 50 percent in recent years. That means you could be looking at a massive bill if you actually use that plan you’re paying for. These deductible increases are of particular concern for young people who may have chosen high-deductible plans because they’re relatively healthy, only to get slammed by debt when an accident or illness strikes.
Feeling a little uncertain about your employer-provided health plan, yet? Well, we’re right there with you. That’s why we set out to determine which states do employee health insurance plans best.
Top States for Employer-Provided Health Insurance
Comparing data from across the nation, we’ve found where residents are getting a relatively good deal on health insurance from their jobs, and where they’re paying quite a lot relative to their average income. We’ve also factored politics into our analysis, comparing the employer-provided insurance prices for states that lean left and right.
Our first state ranking revolves around a simple question: How much of what people make in each state goes toward employer-provided plan premiums? That’s an essential concern for families trying to make ends meet and a good indication of where employer plans stand around the nation. If you live in a Southeastern state, you might not like our answers.
The Percentage of Health Insurance Premiums
Paid by Employees, by State
In all but a handful of states, the average employee contribution was equal to at least 2 percent of their median income. If that doesn’t sound like a lot, think again: Average contributions total $1,500 or more in many states. We’ll take a deeper dive into cost data in a moment, but let’s first consider some of the striking regional trends visible above.
Our best states for employee contributions relative to income were concentrated near the West Coast, with states like Washington, California, and Idaho spending less than 1.75 percent of their incomes on premiums. By contrast, states surrounding the Gulf of Mexico shelled out roughly twice as much of their paychecks annually. Employee contributions in Louisiana, Mississippi, Alabama, and Florida all exceeded 3 percent of each state’s median annual income.
These rates may reflect health challenges experienced throughout the Southeastern region. Louisiana, Alabama, and Mississippi fell among the least healthy states in a recent United Health Foundation ranking, and Florida wasn’t much better. Poor health indicators could push premiums higher for all residents of these states, with businesses passing along costs to their workers.
Perhaps because contributions were so pricey, these states also had some of the lowest rates of participation in these plans. We’ll explore price and the percentage of residents covered by employer plans in more detail below.
Employer-Sponsored Health Insurance Statistics, By State
Not only do states vary significantly in average contribution relative to income, they also demonstrate significant differences in how much of the plan’s cost employees must cover themselves. In Hawaii, for instance, contributions aren’t just low because insurance premiums are cheap overall – employees pay on average less than 1 percent of the median Hawaiian’s income. Compare that to Alabama or New Jersey, where the percentage of plan costs paid by employees is more than twice as high, and you’ll realize just how much that statistic matters.
Interestingly, the percentage of residents covered by an employer-provided plan in each state did not consistently correlate with average contribution as percentage of income. In Utah, for example, contributions are relatively inexpensive, and 60 percent of residents are covered by an employer-provided plan. Yet in California, where contributions represent an identical percentage of income, the percentage covered by employer-provided plans was just 46 percent.
On the other end of the spectrum, however, the relationship between high costs and low participation was far clearer. In each of the 10 states where contributions represented the highest percentage of income, less than half of residents were covered by an employer-provided plan. Perhaps workers in these states are looking elsewhere for cheaper options, or simply deciding to go uninsured altogether.
Insurance Obligation: The Politics of Who Pays for Employer-Provided Plans
 At this point, you may be wondering what might influence employers in a given state to be more or less generous about the percentage of insurance costs they cover. While every employer’s circumstances are unique, could political preference in different parts of the country explain some of the geographical differences we’ve observed thus far?
On the conservative side of the spectrum, it’s easy to imagine a preference for individual responsibility and a lesser burden on businesses. More liberal states, conversely, might emphasize a company’s responsibility to its employees more heavily. Perhaps the political affiliation of each state’s residents and regulators might influence how employer-provided health plans operate.
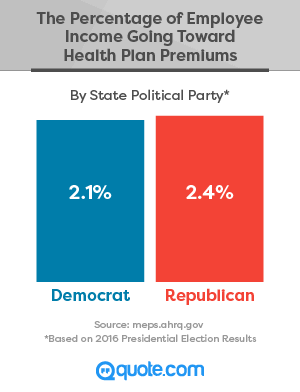
To test this hypothesis, we compared the average contribution as percentage of median income in states that swung Republican or Democrat in the 2016 presidential election.
As we expected, employer-provided plan contributions represented a lower percentage of median income in more liberal states. Could this conclusion be mere coincidence? A closer look at each state’s stats might suggest otherwise.
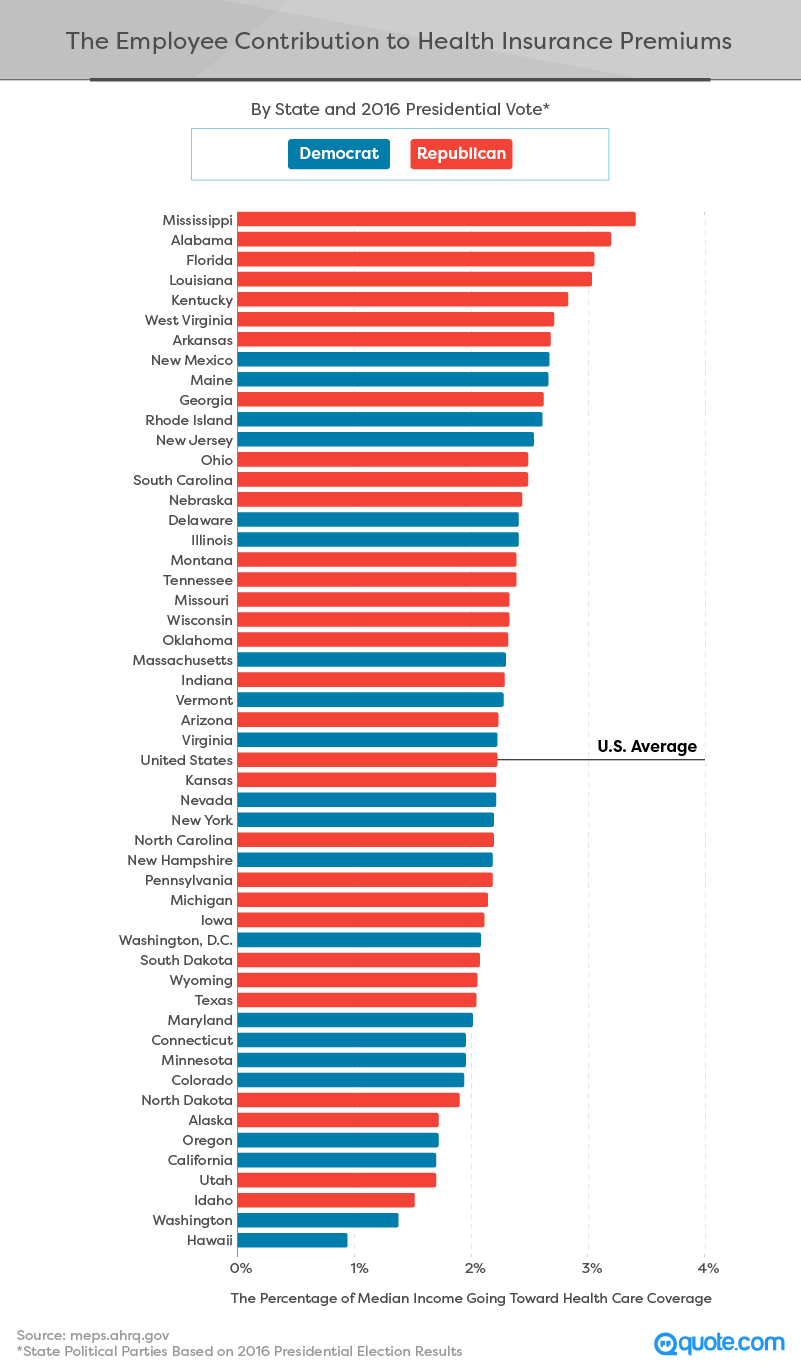
Each of the seven states where average contributions represented the largest portion of median income voted for the Republican candidate in 2016. In fact, with the exception of New Mexico and Maine, the top 10 locations were entirely composed of states that went red in the last presidential election. And it appears that historically conservative states are concentrated above the national average, with a greater number of liberal states falling below that 2.24 percent metric.
Our findings aren’t entirely uniform, however: Residents of some left-leaning states spent a strikingly high percentage of income on their contributions as well. These outliers may owe their rates to local political turbulence. New Mexico’s superintendent of insurance approved a significant rates surge in 2016, while Maine’s insurance marketplace has been thrust into turmoil by the departure of insurers.
Though many local regulators have addressed their recent health insurance concerns to Congress, state governments are limited in that they can only pass legislation that regulates insurance laws, including regulating rates. To consider this element of political influence, we compared the party composition of state legislatures to the percentage of income residents are spending on contributions to their employer-provided health plans.
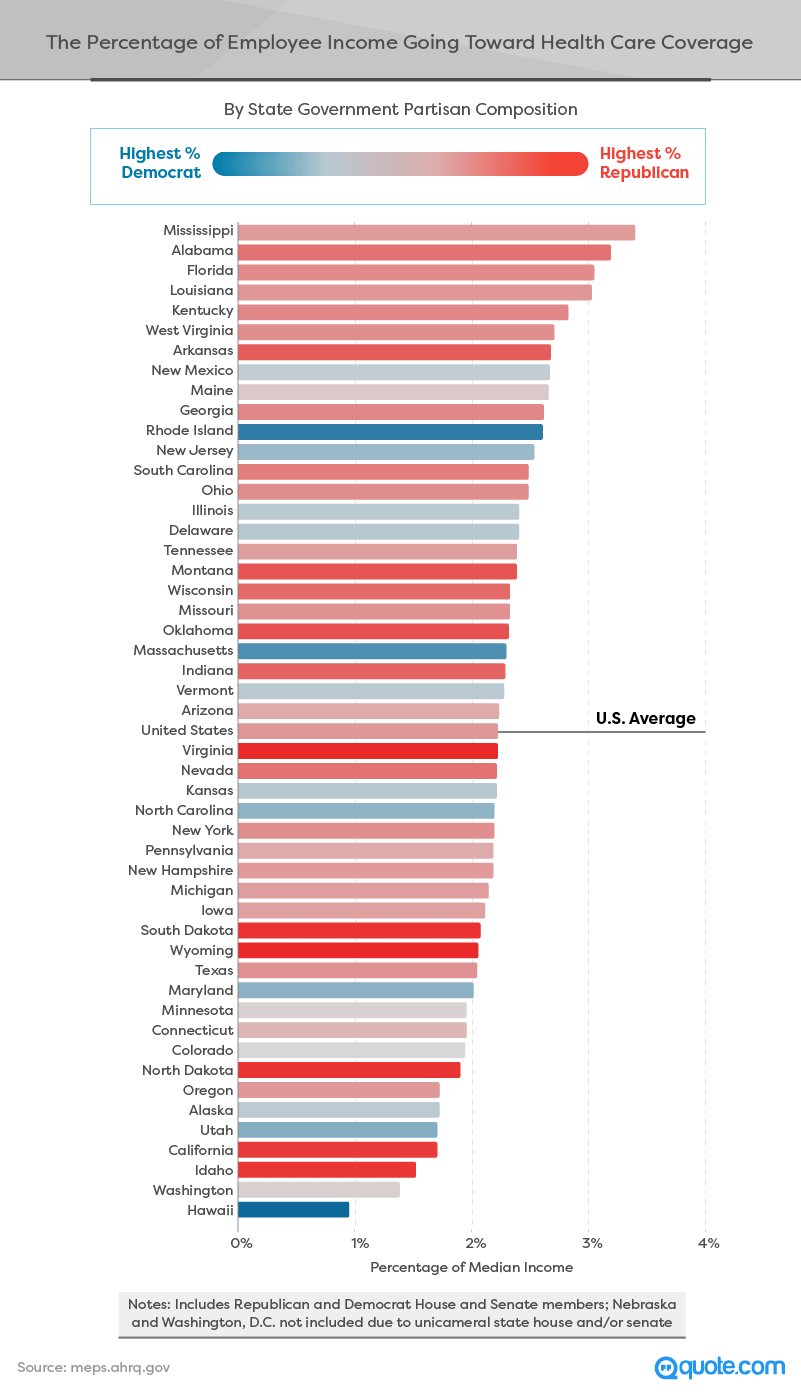
These findings add a layer of complexity to our earlier conclusions because it appears that in many of the states with the most intensely Republican legislatures, residents actually pay little for their contributions relative to their incomes. Idaho and Utah, for instance, have deeply red state legislatures but rank third and fourth respectively when it comes to percentage of income going to health plan contributions. On the other hand, Hawaii, our best-ranked state, has the most overwhelmingly liberal state legislature in the nation.
Perhaps this variation relates in part to relatively recent gains by Republicans in state chambers. Because crafting and influencing policy takes time, the political consequences may still be forthcoming. Yet our data suggest great diversity of policy and opinion, even among states with relatively similar political leanings. As each state’s health care needs reflect its own population and culture, local concerns may make a one-size-fits-all approach impossible.
Conclusion
As our findings make clear, Americans are paying vastly different amounts for coverage from their employers – differences that can have a significant impact on financial security. Still, many of us assume we’re powerless when it comes to our employee health plan – we may be able to select from among a few options, but we’re stuck with the premiums our jobs offer. You may not be able to convince your boss to select a plan that works better for you (or cover more of its cost), but you probably have more flexibility than you realize to find coverage you need at an affordable price.
If you’re paying more than you’d like for coverage that doesn’t meet your needs, you may find a better deal by shopping around the individual health insurance market. It never hurts to learn your options, and you might be surprised by how much you could save.
That’s where our free health insurance quote tool might come in handy, giving you personalized rates from the nation’s best insurers. At Quote.com, that’s what we’re all about – helping you find the best prices for just about anything.
Methodology
We analyzed 2016 data from the U.S. Census Bureau, as well as the Medical Expenditure Panel Survey (MEPS) produced by the Agency for Healthcare Research and Quality. To calculate the percentage of median income going toward an employee’s health plan, we compared reported data to median income levels for each state, as reported by the U.S. Census Bureau as of 2016. State government partisan compositions were gathered from the National Conference of State Legislatures. Nebraska is the only state with a nonpartisan state senate, so it wasn’t included in the state-level government comparison.
Sources
- U.S. Census Bureau - CPS Annual Social and Economic Supplement
- Agency for Healthcare Research and Quality
- National Conference of State Legislatures
- The Henry J. Kaiser Family Foundation
Fair Use
Unlike health care, sharing is one form of caring that won’t cost a thing. We hope you’ll do so with our content, so feel free to share any of the images, facts, and text above for noncommercial purposes. When you do, credit Quote.com with a link back to this page.